46. Introduction
Spring Cloud Sleuth implements a distributed tracing solution for Spring Cloud .
46.1 Terminology
Spring Cloud Sleuth borrows Dapper’s terminology.
Span: The basic unit of work. For example, sending an RPC is a new span, as is sending a response to an RPC. Span’s are identified by a unique 64-bit ID for the span and another 64-bit ID for the trace the span is a part of. Spans also have other data, such as descriptions, timestamped events, key-value annotations (tags), the ID of the span that caused them, and process ID’s (normally IP address).
Spans are started and stopped, and they keep track of their timing information. Once you create a span, you must stop it at some point in the future.
The initial span that starts a trace is called a
root span. The value of span id of that span is equal to trace id.
Trace: A set of spans forming a tree-like structure. For example, if you are running a distributed big-data store, a trace might be formed by a put request.
Annotation: is used to record existence of an event in time. Some of the core annotations used to define the start and stop of a request are:
cs - Client Sent - The client has made a request. This annotation depicts the start of the span.
sr - Server Received - The server side got the request and will start processing it. If one subtracts the cs timestamp from this timestamp one will receive the network latency.
ss - Server Sent - Annotated upon completion of request processing (when the response got sent back to the client). If one subtracts the sr timestamp from this timestamp one will receive the time needed by the server side to process the request.
cr - Client Received - Signifies the end of the span. The client has successfully received the response from the server side. If one subtracts the cs timestamp from this timestamp one will receive the whole time needed by the client to receive the response from the server.
Visualization of what Span and Trace will look in a system together with the Zipkin annotations:
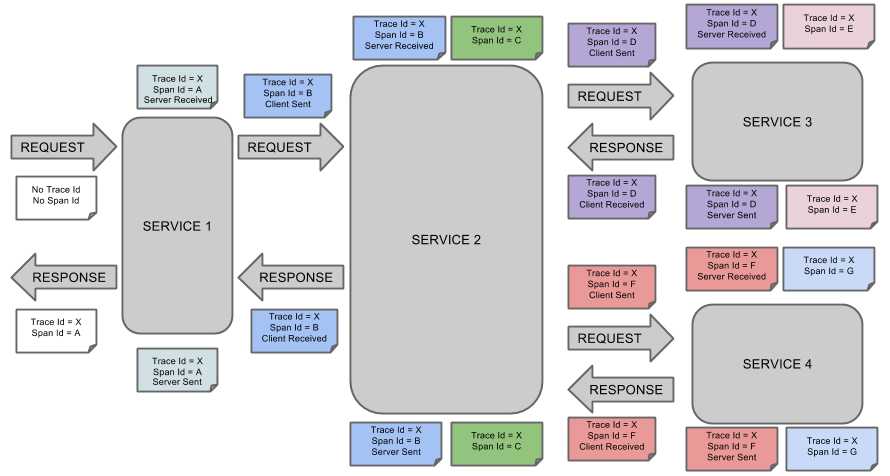
Each color of a note signifies a span (7 spans - from A to G ). If you have such information in the note:
Trace Id = X
Span Id = D
Client Sent
That means that the current span has Trace-Id set to X , Span-Id set to D . It also has emitted Client Sent event.
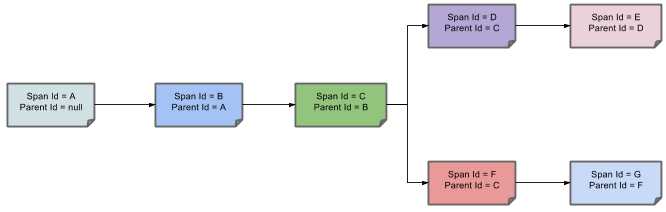
This is how the visualization of the parent / child relationship of spans would look like:
46.2 Purpose
In the following sections the example from the image above will be taken into consideration.
46.2.1 Distributed tracing with Zipkin
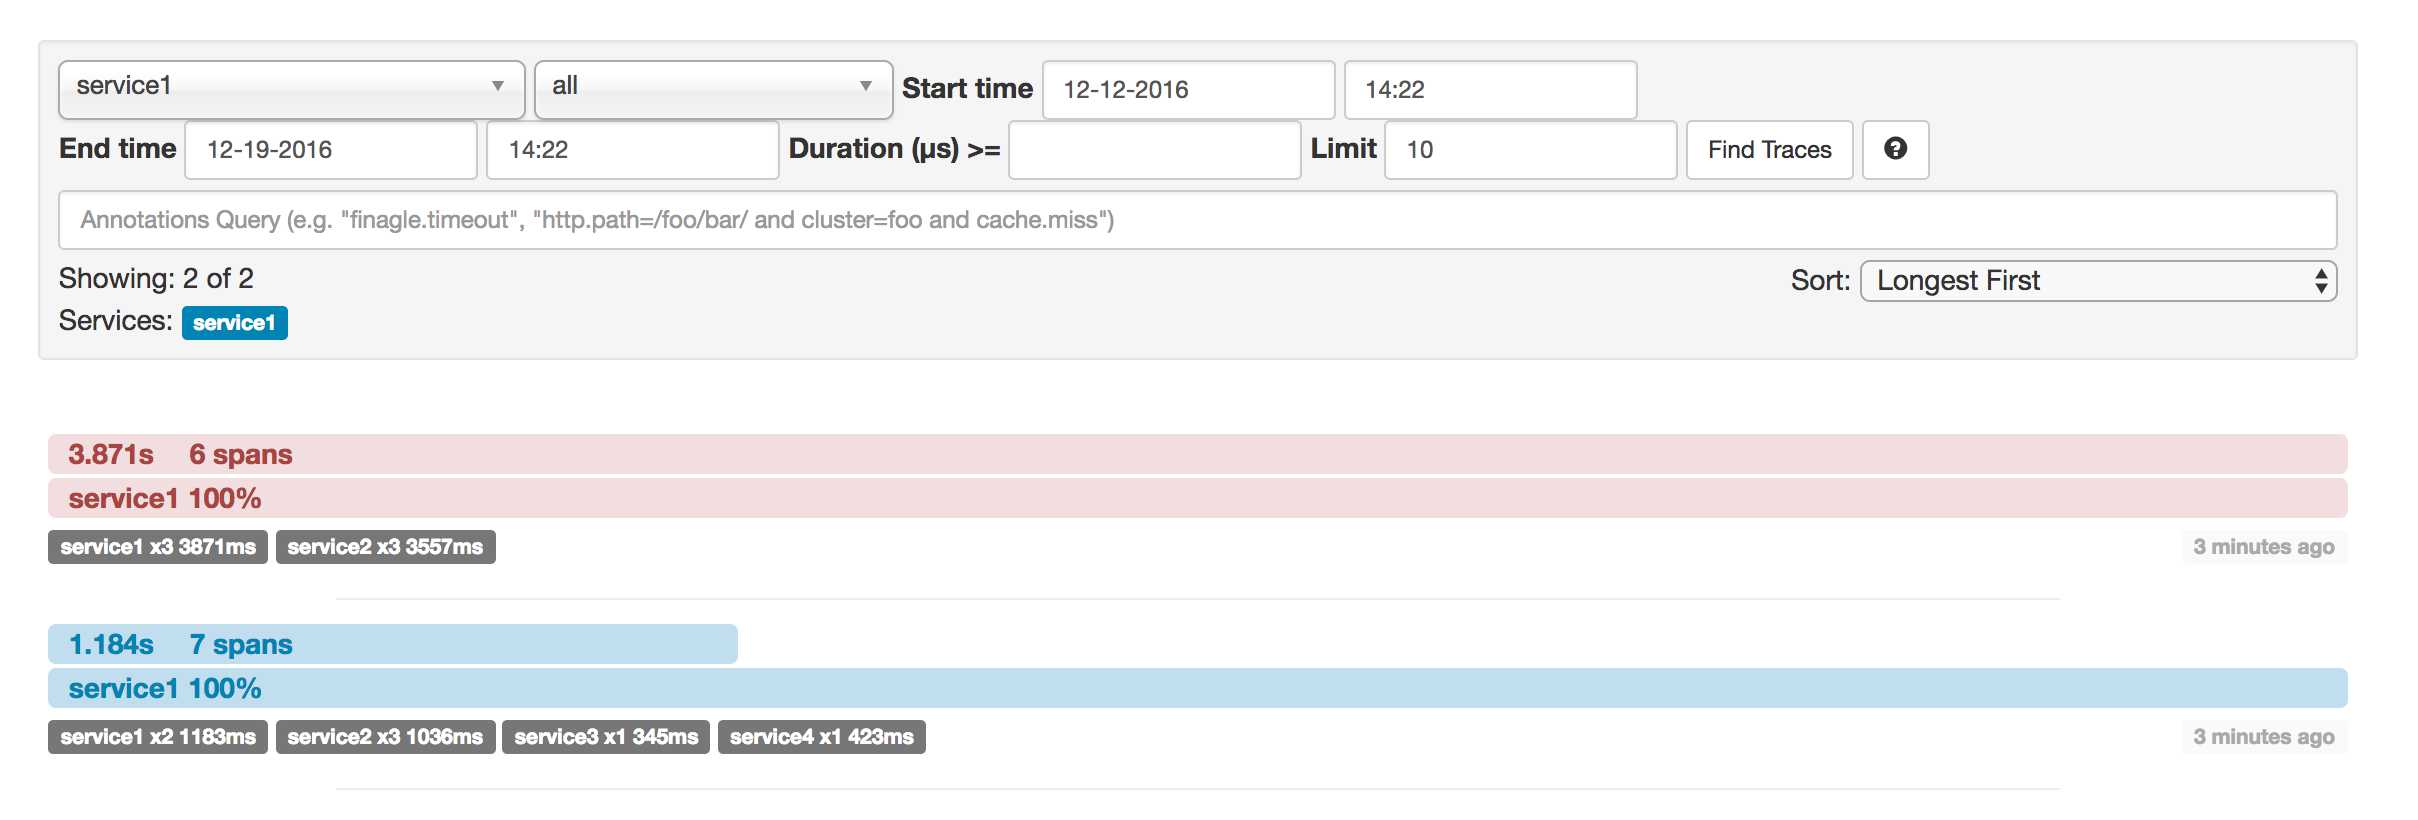
Altogether there are 7 spans . If you go to traces in Zipkin you will see this number in the second trace:
However if you pick a particular trace then you will see 4 spans :
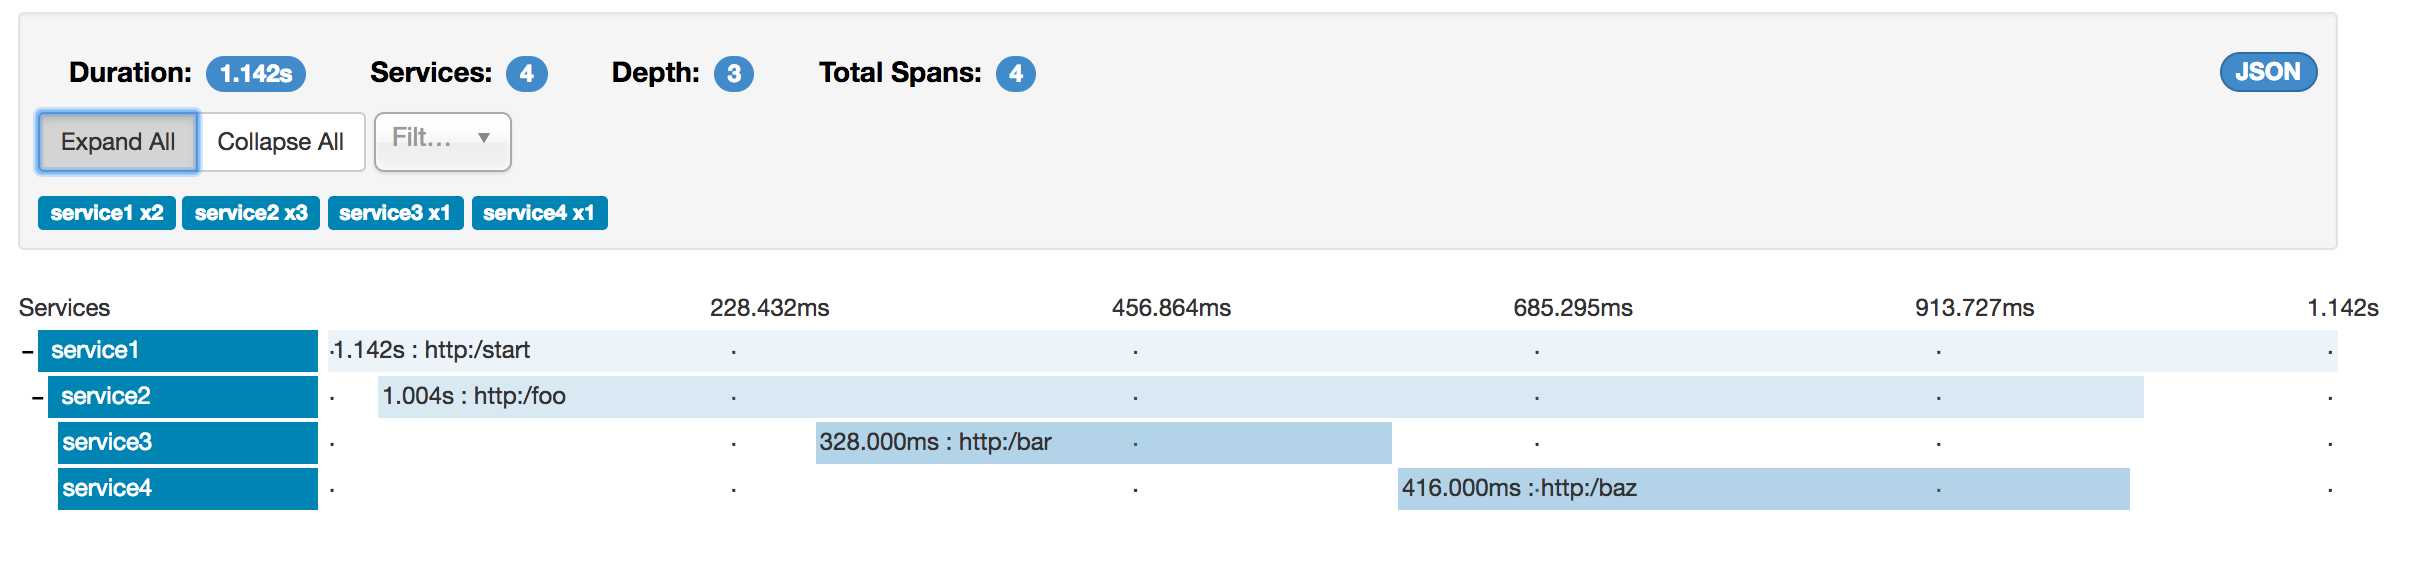
When picking a particular trace you will see merged spans. That means that if there were 2 spans sent to Zipkin with Server Received and Server Sent / Client Received and Client Sent annotations then they will presented as a single span.
Why is there a difference between the 7 and 4 spans in this case?
2 spans come from
http:/startspan. It has the Server Received (SR) and Server Sent (SS) annotations.2 spans come from the RPC call from
service1toservice2to thehttp:/fooendpoint. It has the Client Sent (CS) and Client Received (CR) annotations onservice1side. It also has Server Received (SR) and Server Sent (SS) annotations on theservice2side. Physically there are 2 spans but they form 1 logical span related to an RPC call.2 spans come from the RPC call from
service2toservice3to thehttp:/barendpoint. It has the Client Sent (CS) and Client Received (CR) annotations onservice2side. It also has Server Received (SR) and Server Sent (SS) annotations on theservice3side. Physically there are 2 spans but they form 1 logical span related to an RPC call.2 spans come from the RPC call from
service2toservice4to thehttp:/bazendpoint. It has the Client Sent (CS) and Client Received (CR) annotations onservice2side. It also has Server Received (SR) and Server Sent (SS) annotations on theservice4side. Physically there are 2 spans but they form 1 logical span related to an RPC call.
So if we count the physical spans we have 1 from http:/start , 2 from service1 calling service2 , 2 form service2 calling service3 and 2 from service2 calling service4 . Altogether 7 spans.
Logically we see the information of Total Spans: 4 because we have 1 span related to the incoming request to service1 and 3 spans related to RPC calls.
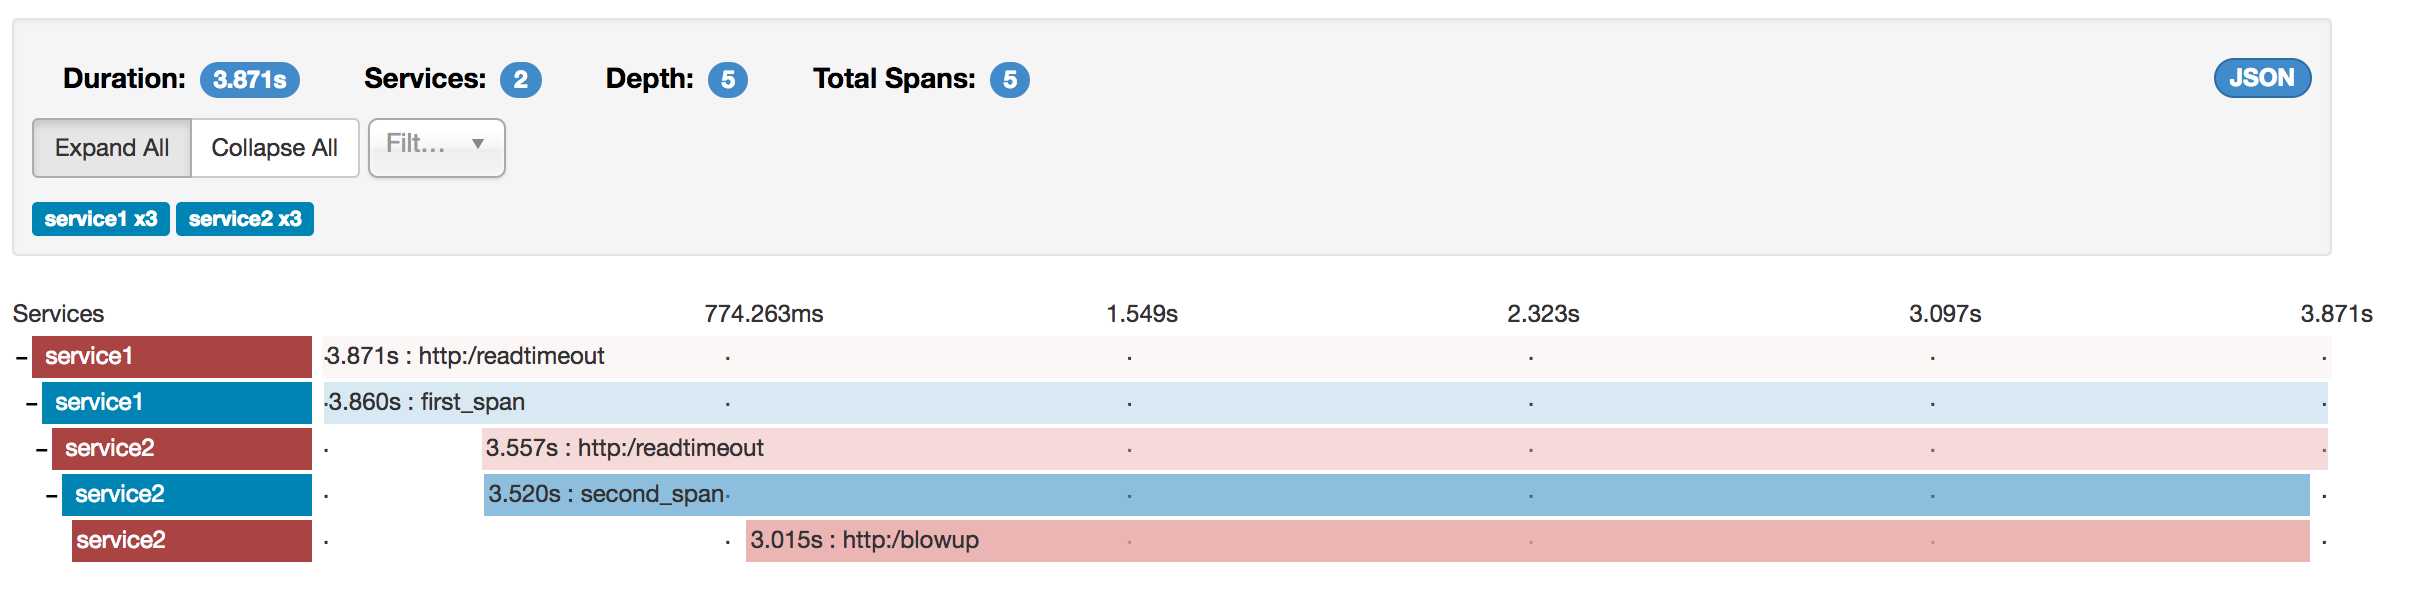
46.2.2 Visualizing errors
Zipkin allows you to visualize errors in your trace. When an exception was thrown and wasn’t caught then we’re setting proper tags on the span which Zipkin can properly colorize. You could see in the list of traces one trace that was in red color. That’s because there was an exception thrown.
If you click that trace then you’ll see a similar picture
Then if you click on one of the spans you’ll see the following
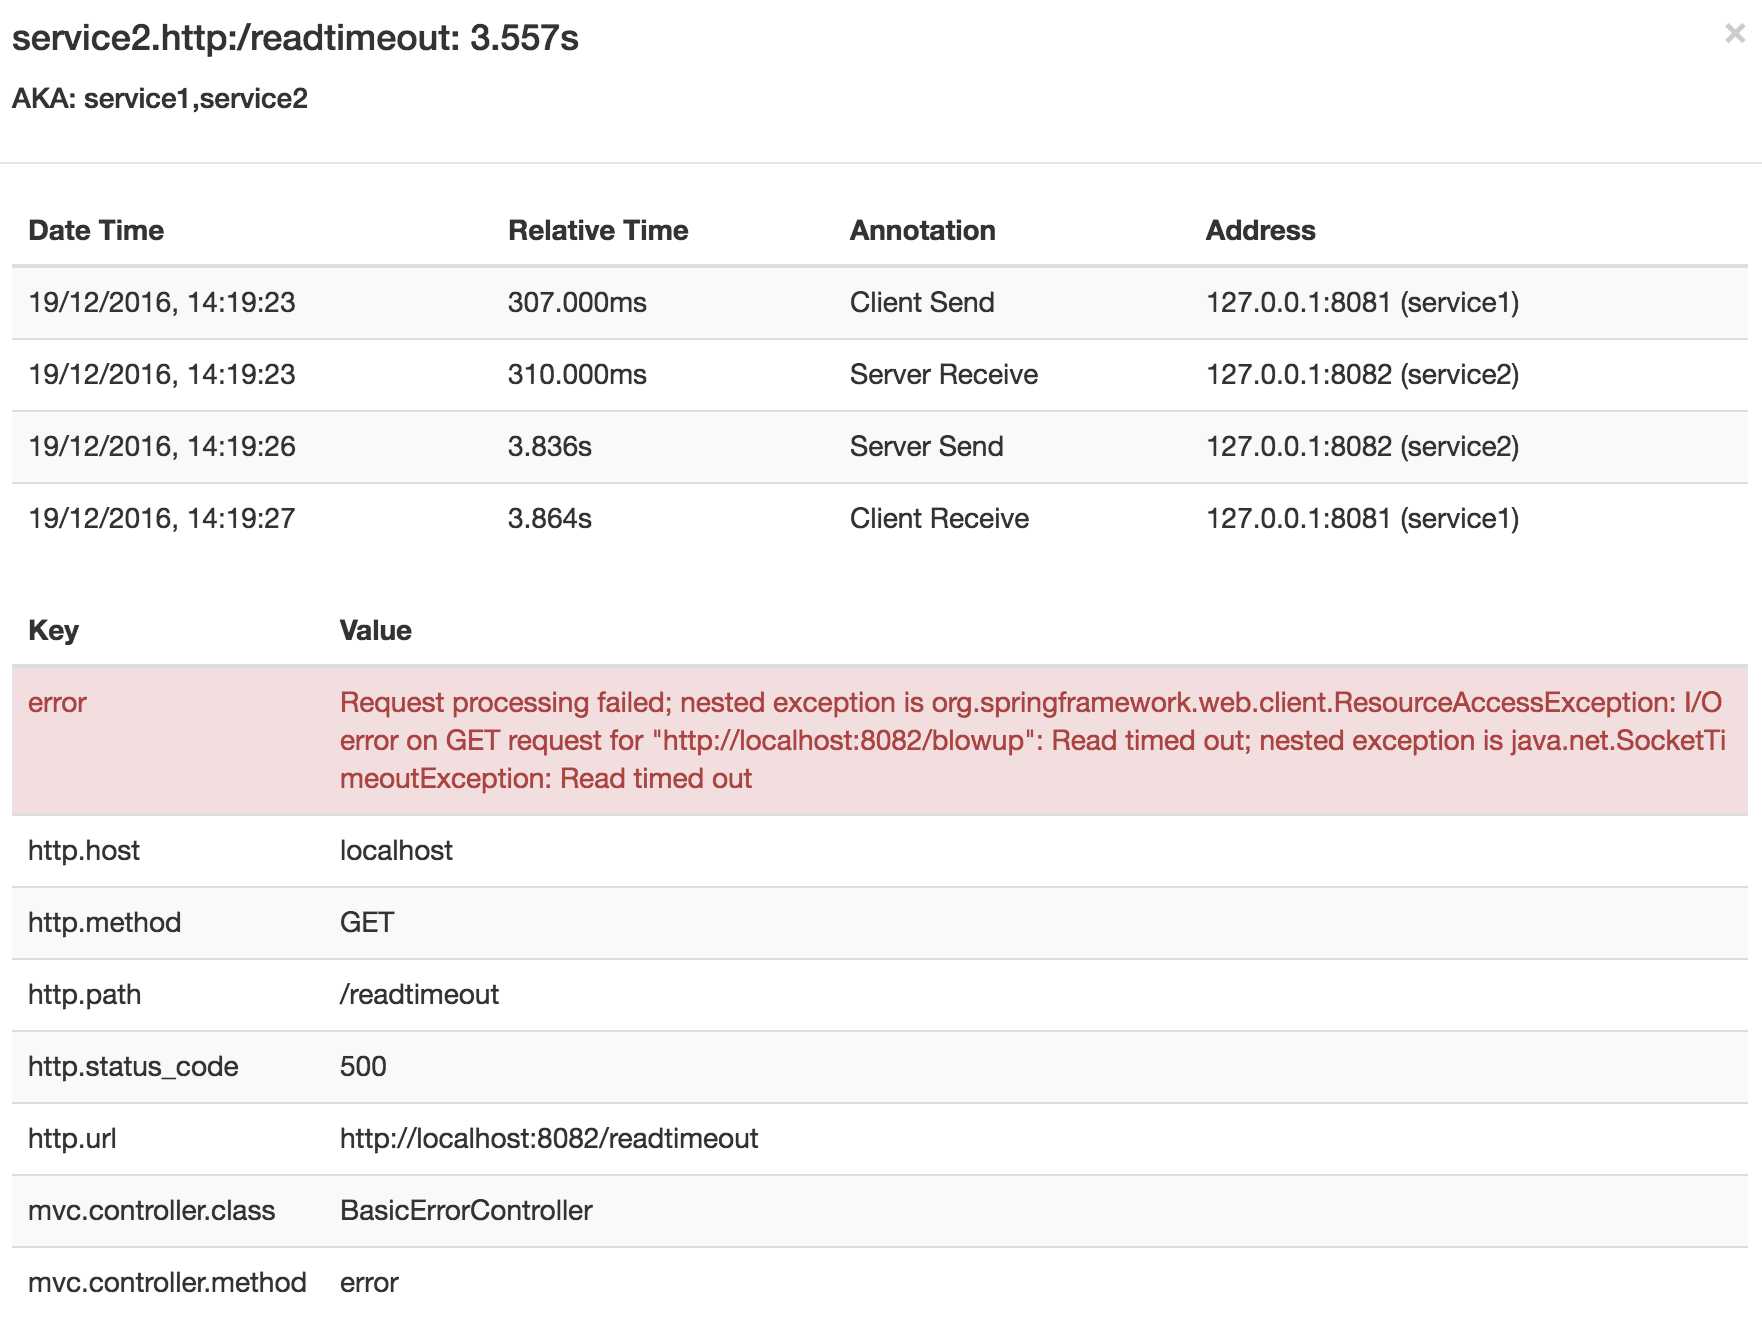
As you can see you can easily see the reason for an error and the whole stacktrace related to it.
46.2.3 Live examples
Figure 46.1. Click Pivotal Web Services icon to see it live!

The dependency graph in Zipkin would look like this:
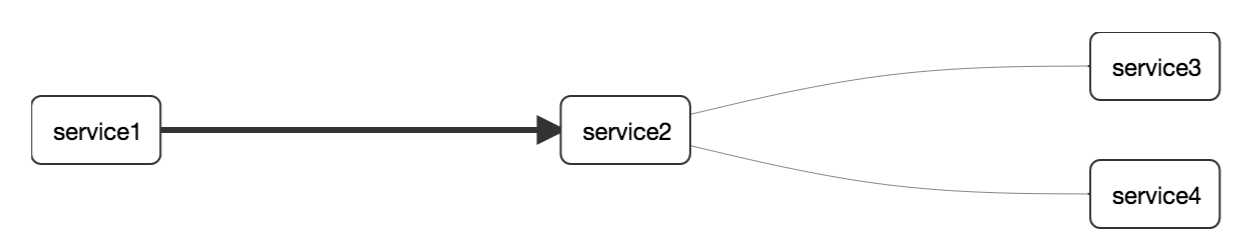
Figure 46.2. Click Pivotal Web Services icon to see it live!
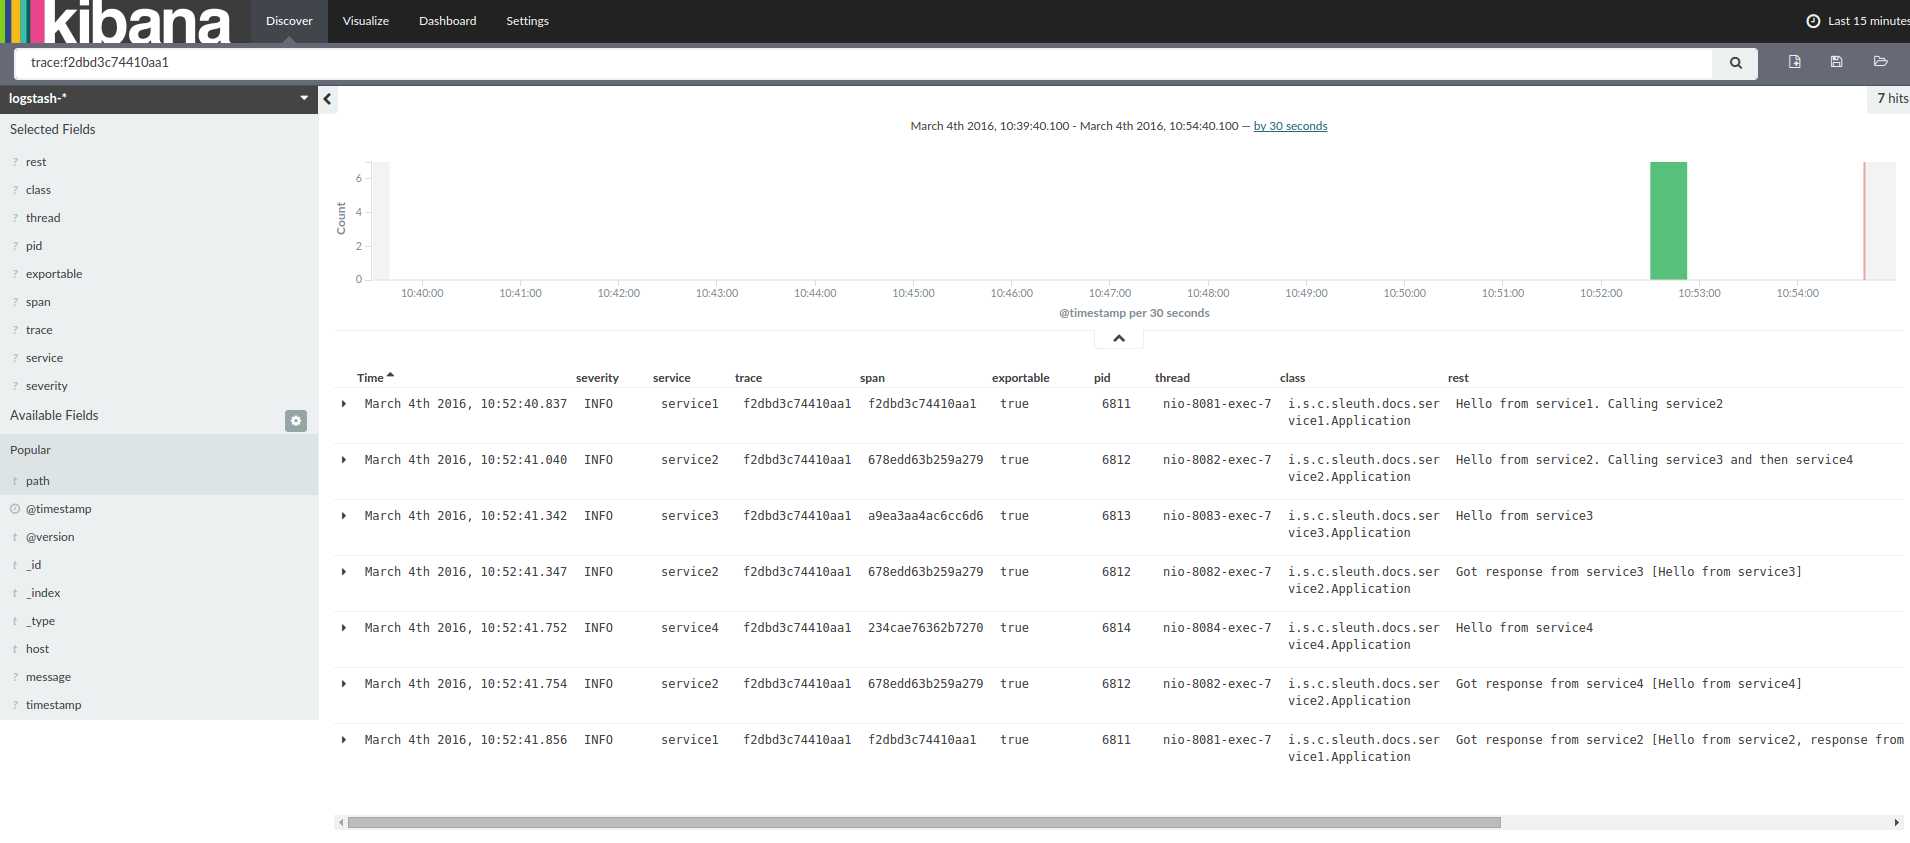
46.2.4 Log correlation
When grepping the logs of those four applications by trace id equal to e.g. 2485ec27856c56f4 one would get the following:
service1.log:2016-02-26 11:15:47.561  INFO [service1,2485ec27856c56f4,2485ec27856c56f4,true] 68058 --- [nio-8081-exec-1] i.s.c.sleuth.docs.service1.Application   : Hello from service1. Calling service2
service2.log:2016-02-26 11:15:47.710  INFO [service2,2485ec27856c56f4,9aa10ee6fbde75fa,true] 68059 --- [nio-8082-exec-1] i.s.c.sleuth.docs.service2.Application   : Hello from service2. Calling service3 and then service4
service3.log:2016-02-26 11:15:47.895  INFO [service3,2485ec27856c56f4,1210be13194bfe5,true] 68060 --- [nio-8083-exec-1] i.s.c.sleuth.docs.service3.Application   : Hello from service3
service2.log:2016-02-26 11:15:47.924  INFO [service2,2485ec27856c56f4,9aa10ee6fbde75fa,true] 68059 --- [nio-8082-exec-1] i.s.c.sleuth.docs.service2.Application   : Got response from service3 [Hello from service3]
service4.log:2016-02-26 11:15:48.134  INFO [service4,2485ec27856c56f4,1b1845262ffba49d,true] 68061 --- [nio-8084-exec-1] i.s.c.sleuth.docs.service4.Application   : Hello from service4
service2.log:2016-02-26 11:15:48.156  INFO [service2,2485ec27856c56f4,9aa10ee6fbde75fa,true] 68059 --- [nio-8082-exec-1] i.s.c.sleuth.docs.service2.Application   : Got response from service4 [Hello from service4]
service1.log:2016-02-26 11:15:48.182  INFO [service1,2485ec27856c56f4,2485ec27856c56f4,true] 68058 --- [nio-8081-exec-1] i.s.c.sleuth.docs.service1.Application   : Got response from service2 [Hello from service2, response from service3 [Hello from service3] and from service4 [Hello from service4]]
If you’re using a log aggregating tool like Kibana , Splunk etc. you can order the events that took place. An example of Kibana would look like this:
If you want to use Logstash here is the Grok pattern for Logstash:
filter {
       # pattern matching logback pattern
       grok {
              match => { "message" => "%{TIMESTAMP_ISO8601:timestamp}\s+%{LOGLEVEL:severity}\s+\[%{DATA:service},%{DATA:trace},%{DATA:span},%{DATA:exportable}\]\s+%{DATA:pid}\s+---\s+\[%{DATA:thread}\]\s+%{DATA:class}\s+:\s+%{GREEDYDATA:rest}" }
       }
}
If you want to use Grok together with the logs from Cloud Foundry you have to use this pattern:
filter {
       # pattern matching logback pattern
       grok {
              match => { "message" => "(?m)OUT\s+%{TIMESTAMP_ISO8601:timestamp}\s+%{LOGLEVEL:severity}\s+\[%{DATA:service},%{DATA:trace},%{DATA:span},%{DATA:exportable}\]\s+%{DATA:pid}\s+---\s+\[%{DATA:thread}\]\s+%{DATA:class}\s+:\s+%{GREEDYDATA:rest}" }
       }
}
JSON Logback with Logstash
Often you do not want to store your logs in a text file but in a JSON file that Logstash can immediately pick. To do that you have to do the following (for readability we’re passing the dependencies in the groupId:artifactId:version notation.
Dependencies setup
Ensure that Logback is on the classpath (
ch.qos.logback:logback-core)Add Logstash Logback encode - example for version
4.6:net.logstash.logback:logstash-logback-encoder:4.6
Logback setup
Below you can find an example of a Logback configuration (file named logback-spring.xml ) that:
logs information from the application in a JSON format to a
build/${spring.application.name}.jsonfilehas commented out two additional appenders - console and standard log file
has the same logging pattern as the one presented in the previous section
<?xml version="1.0" encoding="UTF-8"?>
<configuration>
	<include resource="org/springframework/boot/logging/logback/defaults.xml"/>

	<springProperty scope="context" name="springAppName" source="spring.application.name"/>
	<!-- Example for logging into the build folder of your project -->
	<property name="LOG_FILE" value="${BUILD_FOLDER:-build}/${springAppName}"/>

	<!-- You can override this to have a custom pattern -->
	<property name="CONSOLE_LOG_PATTERN"
			  value="%clr(%d{yyyy-MM-dd HH:mm:ss.SSS}){faint} %clr(${LOG_LEVEL_PATTERN:-%5p}) %clr(${PID:- }){magenta} %clr(---){faint} %clr([%15.15t]){faint} %clr(%-40.40logger{39}){cyan} %clr(:){faint} %m%n${LOG_EXCEPTION_CONVERSION_WORD:-%wEx}"/>

	<!-- Appender to log to console -->
	<appender name="console" class="ch.qos.logback.core.ConsoleAppender">
		<filter class="ch.qos.logback.classic.filter.ThresholdFilter">
			<!-- Minimum logging level to be presented in the console logs-->
			<level>DEBUG</level>
		</filter>
		<encoder>
			<pattern>${CONSOLE_LOG_PATTERN}</pattern>
			<charset>utf8</charset>
		</encoder>
	</appender>

	<!-- Appender to log to file -->
	<appender name="flatfile" class="ch.qos.logback.core.rolling.RollingFileAppender">
		<file>${LOG_FILE}</file>
		<rollingPolicy class="ch.qos.logback.core.rolling.TimeBasedRollingPolicy">
			<fileNamePattern>${LOG_FILE}.%d{yyyy-MM-dd}.gz</fileNamePattern>
			<maxHistory>7</maxHistory>
		</rollingPolicy>
		<encoder>
			<pattern>${CONSOLE_LOG_PATTERN}</pattern>
			<charset>utf8</charset>
		</encoder>
	</appender>

	<!-- Appender to log to file in a JSON format -->
	<appender name="logstash" class="ch.qos.logback.core.rolling.RollingFileAppender">
		<file>${LOG_FILE}.json</file>
		<rollingPolicy class="ch.qos.logback.core.rolling.TimeBasedRollingPolicy">
			<fileNamePattern>${LOG_FILE}.json.%d{yyyy-MM-dd}.gz</fileNamePattern>
			<maxHistory>7</maxHistory>
		</rollingPolicy>
		<encoder class="net.logstash.logback.encoder.LoggingEventCompositeJsonEncoder">
			<providers>
				<timestamp>
					<timeZone>UTC</timeZone>
				</timestamp>
				<pattern>
					<pattern>
						{
						"severity": "%level",
						"service": "${springAppName:-}",
						"trace": "%X{X-B3-TraceId:-}",
						"span": "%X{X-B3-SpanId:-}",
						"parent": "%X{X-B3-ParentSpanId:-}",
						"exportable": "%X{X-Span-Export:-}",
						"pid": "${PID:-}",
						"thread": "%thread",
						"class": "%logger{40}",
						"rest": "%message"
						}
					</pattern>
				</pattern>
			</providers>
		</encoder>
	</appender>

	<root level="INFO">
		<appender-ref ref="console"/>
		<!-- uncomment this to have also JSON logs -->
		<!--<appender-ref ref="logstash"/>-->
		<!--<appender-ref ref="flatfile"/>-->
	</root>
</configuration>
If you’re using a custom
logback-spring.xmlthen you have to pass thespring.application.nameinbootstrapinstead ofapplicationproperty file. Otherwise your custom logback file won’t read the property properly.
46.2.5 Propagating Span Context
The span context is the state that must get propagated to any child Spans across process boundaries. Part of the Span Context is the Baggage. The trace and span IDs are a required part of the span context. Baggage is an optional part.
Baggage is a set of key:value pairs stored in the span context. Baggage travels together with the trace and is attached to every span. Spring Cloud Sleuth will understand that a header is baggage related if the HTTP header is prefixed with baggage- and for messaging it starts with baggage_ .
There’s currently no limitation of the count or size of baggage items. However, keep in mind that too many can decrease system throughput or increase RPC latency. In extreme cases, it could crash the app due to exceeding transport-level message or header capacity.
Example of setting baggage on a span:
Span initialSpan = this.tracer.createSpan("span");
initialSpan.setBaggageItem("foo", "bar");
initialSpan.setBaggageItem("UPPER_CASE", "someValue");
Baggage vs. Span Tags
Baggage travels with the trace (i.e. every child span contains the baggage of its parent). Zipkin has no knowledge of baggage and will not even receive that information.
Tags are attached to a specific span - they are presented for that particular span only. However you can search by tag to find the trace, where there exists a span having the searched tag value.
If you want to be able to lookup a span based on baggage, you should add corresponding entry as a tag in the root span.
@Autowired Tracer tracer;

Span span = tracer.getCurrentSpan();
String baggageKey = "key";
String baggageValue = "foo";
span.setBaggageItem(baggageKey, baggageValue);
tracer.addTag(baggageKey, baggageValue);
46.3 Adding to the project
To ensure that your application name is properly displayed in Zipkin set the
spring.application.nameproperty inbootstrap.yml.
46.3.1 Only Sleuth (log correlation)
If you want to profit only from Spring Cloud Sleuth without the Zipkin integration just add the spring-cloud-starter-sleuth module to your project.
Maven.
<dependencyManagement>
         <dependencies>
             <dependency>
                 <groupId>org.springframework.cloud</groupId>
                 <artifactId>spring-cloud-dependencies</artifactId>
                 <version>${release.train.version}</version>
                 <type>pom</type>
                 <scope>import</scope>
             </dependency>
         </dependencies>
   </dependencyManagement>

   <dependency>
       <groupId>org.springframework.cloud</groupId>
       <artifactId>spring-cloud-starter-sleuth</artifactId>
   </dependency>
In order not to pick versions by yourself it’s much better if you add the dependency management via the Spring BOM
Add the dependency to
spring-cloud-starter-sleuth
Gradle.
dependencyManagement {
    imports {
        mavenBom "org.springframework.cloud:spring-cloud-dependencies:${releaseTrainVersion}"
    }
}

dependencies {
    compile "org.springframework.cloud:spring-cloud-starter-sleuth"
}
In order not to pick versions by yourself it’s much better if you add the dependency management via the Spring BOM
Add the dependency to
spring-cloud-starter-sleuth
46.3.2 Sleuth with Zipkin via HTTP
If you want both Sleuth and Zipkin just add the spring-cloud-starter-zipkin dependency.
Maven.
<dependencyManagement>
         <dependencies>
             <dependency>
                 <groupId>org.springframework.cloud</groupId>
                 <artifactId>spring-cloud-dependencies</artifactId>
                 <version>${release.train.version}</version>
                 <type>pom</type>
                 <scope>import</scope>
             </dependency>
         </dependencies>
   </dependencyManagement>

   <dependency>
       <groupId>org.springframework.cloud</groupId>
       <artifactId>spring-cloud-starter-zipkin</artifactId>
   </dependency>
In order not to pick versions by yourself it’s much better if you add the dependency management via the Spring BOM
Add the dependency to
spring-cloud-starter-zipkin
Gradle.
dependencyManagement {
    imports {
        mavenBom "org.springframework.cloud:spring-cloud-dependencies:${releaseTrainVersion}"
    }
}

dependencies {
    compile "org.springframework.cloud:spring-cloud-starter-zipkin"
}
In order not to pick versions by yourself it’s much better if you add the dependency management via the Spring BOM
Add the dependency to
spring-cloud-starter-zipkin
46.3.3 Sleuth with Zipkin via RabbitMQ or Kafka
If you want to use RabbitMQ or Kafka instead of http, add the spring-rabbit or spring-kafka dependencies. The default destination name is zipkin .
Note: spring-cloud-sleuth-stream is deprecated and incompatible with these destinations
If you want Sleuth over RabbitMQ add the spring-cloud-starter-zipkin and spring-rabbit dependencies.
Maven.
<dependencyManagement>
         <dependencies>
             <dependency>
                 <groupId>org.springframework.cloud</groupId>
                 <artifactId>spring-cloud-dependencies</artifactId>
                 <version>${release.train.version}</version>
                 <type>pom</type>
                 <scope>import</scope>
             </dependency>
         </dependencies>
   </dependencyManagement>

   <dependency>
       <groupId>org.springframework.cloud</groupId>
       <artifactId>spring-cloud-starter-zipkin</artifactId>
   </dependency>
   <dependency>
       <groupId>org.springframework.amqp</groupId>
       <artifactId>spring-rabbit</artifactId>
   </dependency>
In order not to pick versions by yourself it’s much better if you add the dependency management via the Spring BOM
Add the dependency to
spring-cloud-starter-zipkin- that way all dependent dependencies will be downloaded
To automatically configure rabbit, simply add the spring-rabbit dependency
Gradle.
dependencyManagement {
    imports {
        mavenBom "org.springframework.cloud:spring-cloud-dependencies:${releaseTrainVersion}"
    }
}

dependencies {
    compile "org.springframework.cloud:spring-cloud-starter-zipkin"
    compile "org.springframework.amqp:spring-rabbit"
}
In order not to pick versions by yourself it’s much better if you add the dependency management via the Spring BOM
Add the dependency to
spring-cloud-starter-zipkin- that way all dependent dependencies will be downloaded
To automatically configure rabbit, simply add the spring-rabbit dependency