matplotlib.axes.Axes.errorbar
Axes.errorbar(x, y, yerr=None, xerr=None, fmt='', ecolor=None, elinewidth=None, capsize=None, barsabove=False, lolims=False, uplims=False, xlolims=False, xuplims=False, errorevery=1, capthick=None, **kwargs)-
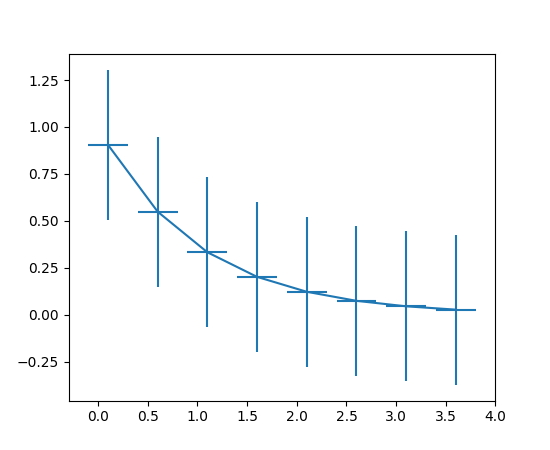
Plot an errorbar graph.
Plot x versus y with error deltas in yerr and xerr. Vertical errorbars are plotted if yerr is not None. Horizontal errorbars are plotted if xerr is not None.
x, y, xerr, and yerr can all be scalars, which plots a single error bar at x, y.
Parameters: x : scalar or array-like
y : scalar or array-like
xerr/yerr : scalar or array-like, shape(N,) or shape(2,N), optional
If a scalar number, len(N) array-like object, or a N-element array-like object, errorbars are drawn at +/-value relative to the data. Default is None.
If a sequence of shape 2xN, errorbars are drawn at -row1 and +row2 relative to the data.
fmt : plot format string, optional, default: None
The plot format symbol. If fmt is ‘none’ (case-insensitive), only the errorbars are plotted. This is used for adding errorbars to a bar plot, for example. Default is ‘’, an empty plot format string; properties are then identical to the defaults for
plot().ecolor : mpl color, optional, default: None
A matplotlib color arg which gives the color the errorbar lines; if None, use the color of the line connecting the markers.
elinewidth : scalar, optional, default: None
The linewidth of the errorbar lines. If None, use the linewidth.
capsize : scalar, optional, default: None
The length of the error bar caps in points; if None, it will take the value from
errorbar.capsizercParam.capthick : scalar, optional, default: None
An alias kwarg to markeredgewidth (a.k.a. - mew). This setting is a more sensible name for the property that controls the thickness of the error bar cap in points. For backwards compatibility, if mew or markeredgewidth are given, then they will over-ride capthick. This may change in future releases.
barsabove : bool, optional, default: False
if True , will plot the errorbars above the plot symbols. Default is below.
lolims / uplims / xlolims / xuplims : bool, optional, default:None
These arguments can be used to indicate that a value gives only upper/lower limits. In that case a caret symbol is used to indicate this. lims-arguments may be of the same type as xerr and yerr. To use limits with inverted axes,
set_xlim()orset_ylim()must be called beforeerrorbar().errorevery : positive integer, optional, default:1
subsamples the errorbars. e.g., if errorevery=5, errorbars for every 5-th datapoint will be plotted. The data plot itself still shows all data points.
Returns: plotline :
Line2Dinstancex, y plot markers and/or line
caplines : list of
Line2Dinstanceserror bar cap
barlinecols : list of
LineCollectionhorizontal and vertical error ranges.
Other Parameters: kwargs : All other keyword arguments are passed on to the plot
command for the markers. For example, this code makes big red squares with thick green edges:
x,y,yerr = rand(3,10)
errorbar(x, y, yerr, marker='s', mfc='red',
         mec='green', ms=20, mew=4)
where mfc, mec, ms and mew are aliases for the longer property names, markerfacecolor, markeredgecolor, markersize and markeredgewidth.
valid kwargs for the marker properties are
Property Description agg_filterunknown alphafloat (0.0 transparent through 1.0 opaque) animated[True | False] antialiasedor aa[True | False] axesan Axesinstanceclip_boxa matplotlib.transforms.Bboxinstanceclip_on[True | False] clip_path[ ( Path,Transform) |Patch| None ]coloror cany matplotlib color containsa callable function dash_capstyle[‘butt’ | ‘round’ | ‘projecting’] dash_joinstyle[‘miter’ | ‘round’ | ‘bevel’] dashessequence of on/off ink in points drawstyle[‘default’ | ‘steps’ | ‘steps-pre’ | ‘steps-mid’ | ‘steps-post’] figurea matplotlib.figure.Figureinstancefillstyle[‘full’ | ‘left’ | ‘right’ | ‘bottom’ | ‘top’ | ‘none’] gidan id string labelstring or anything printable with ‘%s’ conversion. linestyleor ls[‘solid’ | ‘dashed’, ‘dashdot’, ‘dotted’ | (offset, on-off-dash-seq) | '-'|'--'|'-.'|':'|'None'|' '|'']linewidthor lwfloat value in points markerA valid marker stylemarkeredgecoloror mecany matplotlib color markeredgewidthor mewfloat value in points markerfacecoloror mfcany matplotlib color markerfacecoloraltor mfcaltany matplotlib color markersizeor msfloat markevery[None | int | length-2 tuple of int | slice | list/array of int | float | length-2 tuple of float] path_effectsunknown pickerfloat distance in points or callable pick function fn(artist, event)pickradiusfloat distance in points rasterized[True | False | None] sketch_paramsunknown snapunknown solid_capstyle[‘butt’ | ‘round’ | ‘projecting’] solid_joinstyle[‘miter’ | ‘round’ | ‘bevel’] transforma matplotlib.transforms.Transforminstanceurla url string visible[True | False] xdata1D array ydata1D array zorderany number Examples
(Source code, png, pdf)

Note
In addition to the above described arguments, this function can take a data keyword argument. If such a data argument is given, the following arguments are replaced by data[<arg>]:
- All arguments with the following names: ‘x’, ‘xerr’, ‘y’, ‘yerr’.
© 2012–2017 Matplotlib Development Team. All rights reserved.
Licensed under the Matplotlib License Agreement.
http://matplotlib.org/2.0.2/api/_as_gen/matplotlib.axes.Axes.errorbar.html