matplotlib.axes.Axes.legend
Axes.legend(*args, **kwargs)-
Places a legend on the axes.
To make a legend for lines which already exist on the axes (via plot for instance), simply call this function with an iterable of strings, one for each legend item. For example:
ax.plot([1, 2, 3])
ax.legend(['A simple line'])
However, in order to keep the “label” and the legend element instance together, it is preferable to specify the label either at artist creation, or by calling the
set_label()method on the artist:line, = ax.plot([1, 2, 3], label='Inline label') # Overwrite the label by calling the method. line.set_label('Label via method') ax.legend()Specific lines can be excluded from the automatic legend element selection by defining a label starting with an underscore. This is default for all artists, so calling
legend()without any arguments and without setting the labels manually will result in no legend being drawn.For full control of which artists have a legend entry, it is possible to pass an iterable of legend artists followed by an iterable of legend labels respectively:
legend((line1, line2, line3), ('label1', 'label2', 'label3'))Parameters: loc : int or string or pair of floats, default: ‘upper right’
The location of the legend. Possible codes are:
Location String Location Code ‘best’ 0 ‘upper right’ 1 ‘upper left’ 2 ‘lower left’ 3 ‘lower right’ 4 ‘right’ 5 ‘center left’ 6 ‘center right’ 7 ‘lower center’ 8 ‘upper center’ 9 ‘center’ 10 Alternatively can be a 2-tuple giving
x, yof the lower-left corner of the legend in axes coordinates (in which casebbox_to_anchorwill be ignored).bbox_to_anchor :
matplotlib.transforms.BboxBaseinstance or tuple of floatsSpecify any arbitrary location for the legend in
bbox_transformcoordinates (default Axes coordinates).For example, to put the legend’s upper right hand corner in the center of the axes the following keywords can be used:
loc='upper right', bbox_to_anchor=(0.5, 0.5)ncol : integer
The number of columns that the legend has. Default is 1.
prop : None or
matplotlib.font_manager.FontPropertiesor dictThe font properties of the legend. If None (default), the current
matplotlib.rcParamswill be used.fontsize : int or float or {‘xx-small’, ‘x-small’, ‘small’, ‘medium’, ‘large’, ‘x-large’, ‘xx-large’}
Controls the font size of the legend. If the value is numeric the size will be the absolute font size in points. String values are relative to the current default font size. This argument is only used if
propis not specified.numpoints : None or int
The number of marker points in the legend when creating a legend entry for a line/
matplotlib.lines.Line2D. Default isNonewhich will take the value from thelegend.numpointsrcParam.scatterpoints : None or int
The number of marker points in the legend when creating a legend entry for a scatter plot/
matplotlib.collections.PathCollection. Default isNonewhich will take the value from thelegend.scatterpointsrcParam.scatteryoffsets : iterable of floats
The vertical offset (relative to the font size) for the markers created for a scatter plot legend entry. 0.0 is at the base the legend text, and 1.0 is at the top. To draw all markers at the same height, set to
[0.5]. Default[0.375, 0.5, 0.3125].markerscale : None or int or float
The relative size of legend markers compared with the originally drawn ones. Default is
Nonewhich will take the value from thelegend.markerscalercParam.markerfirst : bool
If True, legend marker is placed to the left of the legend label. If False, legend marker is placed to the right of the legend label. Default is True.
frameon : None or bool
Control whether the legend should be drawn on a patch (frame). Default is
Nonewhich will take the value from thelegend.frameonrcParam.fancybox : None or bool
Control whether round edges should be enabled around the
FancyBboxPatchwhich makes up the legend’s background. Default isNonewhich will take the value from thelegend.fancyboxrcParam.shadow : None or bool
Control whether to draw a shadow behind the legend. Default is
Nonewhich will take the value from thelegend.shadowrcParam.framealpha : None or float
Control the alpha transparency of the legend’s background. Default is
Nonewhich will take the value from thelegend.framealpharcParam. If shadow is activated and framealpha isNonethe default value is being ignored.facecolor : None or “inherit” or a color spec
Control the legend’s background color. Default is
Nonewhich will take the value from thelegend.facecolorrcParam. If"inherit", it will take theaxes.facecolorrcParam.edgecolor : None or “inherit” or a color spec
Control the legend’s background patch edge color. Default is
Nonewhich will take the value from thelegend.edgecolorrcParam. If"inherit", it will take theaxes.edgecolorrcParam.mode : {“expand”, None}
If
modeis set to"expand"the legend will be horizontally expanded to fill the axes area (orbbox_to_anchorif defines the legend’s size).bbox_transform : None or
matplotlib.transforms.TransformThe transform for the bounding box (
bbox_to_anchor). For a value ofNone(default) the Axes’transAxestransform will be used.title : str or None
The legend’s title. Default is no title (
None).borderpad : float or None
The fractional whitespace inside the legend border. Measured in font-size units. Default is
Nonewhich will take the value from thelegend.borderpadrcParam.labelspacing : float or None
The vertical space between the legend entries. Measured in font-size units. Default is
Nonewhich will take the value from thelegend.labelspacingrcParam.handlelength : float or None
The length of the legend handles. Measured in font-size units. Default is
Nonewhich will take the value from thelegend.handlelengthrcParam.handletextpad : float or None
The pad between the legend handle and text. Measured in font-size units. Default is
Nonewhich will take the value from thelegend.handletextpadrcParam.borderaxespad : float or None
The pad between the axes and legend border. Measured in font-size units. Default is
Nonewhich will take the value from thelegend.borderaxespadrcParam.columnspacing : float or None
The spacing between columns. Measured in font-size units. Default is
Nonewhich will take the value from thelegend.columnspacingrcParam.handler_map : dict or None
The custom dictionary mapping instances or types to a legend handler. This
handler_mapupdates the default handler map found atmatplotlib.legend.Legend.get_legend_handler_map().Notes
Not all kinds of artist are supported by the legend command. See Legend guide for details.
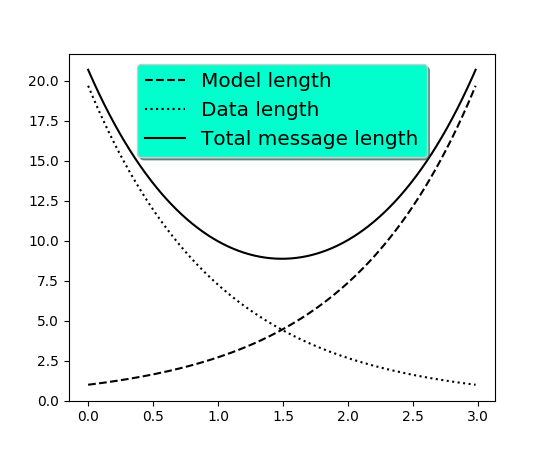
Examples
(Source code, png, pdf)

© 2012–2017 Matplotlib Development Team. All rights reserved.
Licensed under the Matplotlib License Agreement.
http://matplotlib.org/2.1.0/api/_as_gen/matplotlib.axes.Axes.legend.html