On this page
Debugging Applications
Depending on the WSGI gateway/server, exceptions are handled differently. Most of the time, exceptions go to stderr or the error log, and a generic “500 Internal Server Error” message is displayed.
Since this is not the best debugging environment, Werkzeug provides a WSGI middleware that renders nice tracebacks, optionally with an interactive debug console to execute code in any frame.
Danger
The debugger allows the execution of arbitrary code which makes it a major security risk. The debugger must never be used on production machines. We cannot stress this enough. Do not enable the debugger in production.
Note
The interactive debugger does not work in forking environments, such as a server that starts multiple processes. Most such environments are production servers, where the debugger should not be enabled anyway.
Enabling the Debugger
Enable the debugger by wrapping the application with the DebuggedApplication middleware. Alternatively, you can pass use_debugger=True to run_simple() and it will do that for you.
class werkzeug.debug.DebuggedApplication(app, evalex=False, request_key='werkzeug.request', console_path='/console', console_init_func=None, show_hidden_frames=False, pin_security=True, pin_logging=True)-
Enables debugging support for a given application:
from werkzeug.debug import DebuggedApplication
from myapp import app
app = DebuggedApplication(app, evalex=True)
The
evalexargument allows evaluating expressions in any frame of a traceback. This works by preserving each frame with its local state. Some state, such as context globals, cannot be restored with the frame by default. Whenevalexis enabled,environ["werkzeug.debug.preserve_context"]will be a callable that takes a context manager, and can be called multiple times. Each context manager will be entered before evaluating code in the frame, then exited again, so they can perform setup and cleanup for each call.- Parameters:
-
- app (WSGIApplication) – the WSGI application to run debugged.
- evalex (bool) – enable exception evaluation feature (interactive debugging). This requires a non-forking server.
- request_key (str) – The key that points to the request object in this environment. This parameter is ignored in current versions.
- console_path (str) – the URL for a general purpose console.
- console_init_func (t.Callable[[], dict[str, t.Any]] | None) – the function that is executed before starting the general purpose console. The return value is used as initial namespace.
- show_hidden_frames (bool) – by default hidden traceback frames are skipped. You can show them by setting this parameter to
True. - pin_security (bool) – can be used to disable the pin based security system.
- pin_logging (bool) – enables the logging of the pin system.
Changelog
Changed in version 2.2: Added the
werkzeug.debug.preserve_contextenviron key.
Using the Debugger
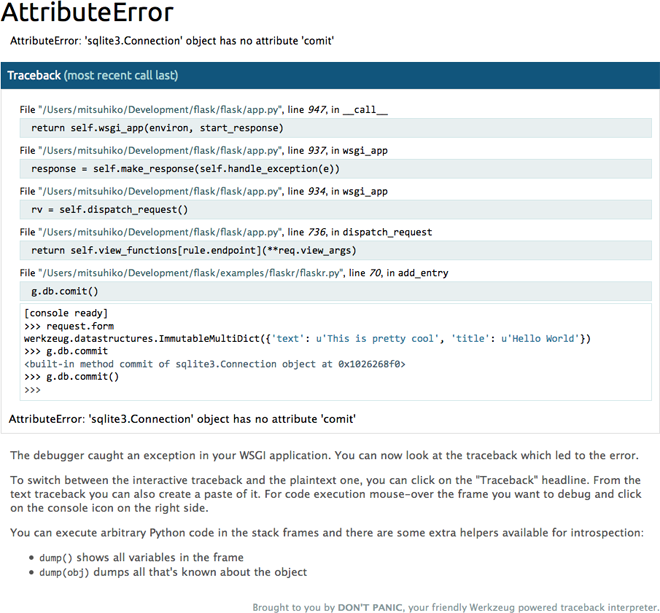
Once enabled and an error happens during a request you will see a detailed traceback instead of a generic “internal server error”. The traceback is still output to the terminal as well.
The error message is displayed at the top. Clicking it jumps to the bottom of the traceback. Frames that represent user code, as opposed to built-ins or installed packages, are highlighted blue. Clicking a frame will show more lines for context, clicking again will hide them.
If you have the evalex feature enabled you can get a console for every frame in the traceback by hovering over a frame and clicking the console icon that appears at the right. Once clicked a console opens where you can execute Python code in:

Inside the interactive consoles you can execute any kind of Python code. Unlike regular Python consoles the output of the object reprs is colored and stripped to a reasonable size by default. If the output is longer than what the console decides to display a small plus sign is added to the repr and a click will expand the repr.
To display all variables that are defined in the current frame you can use the dump() function. You can call it without arguments to get a detailed list of all variables and their values, or with an object as argument to get a detailed list of all the attributes it has.
Debugger PIN
Starting with Werkzeug 0.11 the debug console is protected by a PIN. This is a security helper to make it less likely for the debugger to be exploited if you forget to disable it when deploying to production. The PIN based authentication is enabled by default.
The first time a console is opened, a dialog will prompt for a PIN that is printed to the command line. The PIN is generated in a stable way that is specific to the project. An explicit PIN can be provided through the environment variable WERKZEUG_DEBUG_PIN. This can be set to a number and will become the PIN. This variable can also be set to the value off to disable the PIN check entirely.
If an incorrect PIN is entered too many times the server needs to be restarted.
This feature is not meant to entirely secure the debugger. It is intended to make it harder for an attacker to exploit the debugger. Never enable the debugger in production.
Pasting Errors
If you click on the “Traceback (most recent call last)” header, the view switches to a traditional text-based traceback. You can copy and paste this in order to provide information when asking a question or reporting an issue.
© 2007 Pallets
Licensed under the BSD 3-clause License.
https://werkzeug.palletsprojects.com/en/3.0.x/debug/