Analyze Query Performance
On this page
- Mongo Shell
- Compass
The cursor.explain("executionStats") and the db.collection.explain("executionStats") methods provide statistics about the performance of a query. These statistics can be useful in measuring if and how a query uses an index.
db.collection.explain() provides information on the execution of other operations, such as db.collection.update(). See db.collection.explain() for details.
MongoDB Compass provides an Explain Plan tab, which displays statistics about the performance of a query. These statistics can be useful in measuring if and how a query uses an index.
Evaluate the Performance of a Query
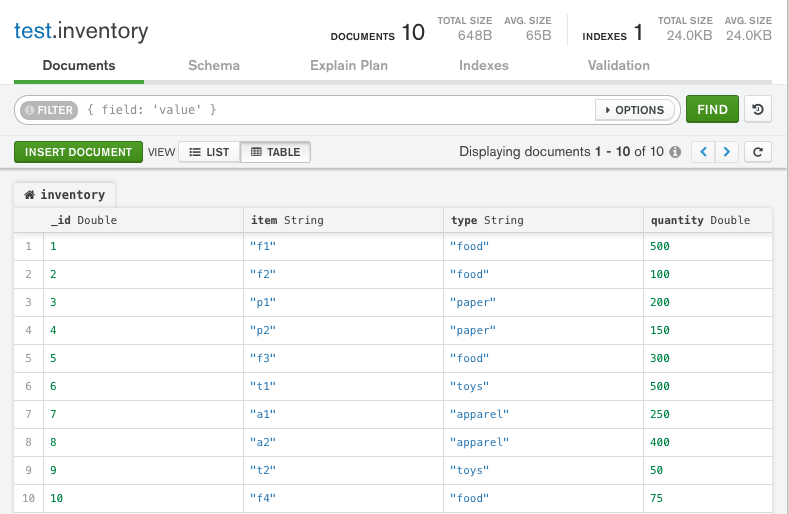
Consider a collection inventory with the following documents:
{ "_id" : 1, "item" : "f1", type: "food", quantity: 500 }
{ "_id" : 2, "item" : "f2", type: "food", quantity: 100 }
{ "_id" : 3, "item" : "p1", type: "paper", quantity: 200 }
{ "_id" : 4, "item" : "p2", type: "paper", quantity: 150 }
{ "_id" : 5, "item" : "f3", type: "food", quantity: 300 }
{ "_id" : 6, "item" : "t1", type: "toys", quantity: 500 }
{ "_id" : 7, "item" : "a1", type: "apparel", quantity: 250 }
{ "_id" : 8, "item" : "a2", type: "apparel", quantity: 400 }
{ "_id" : 9, "item" : "t2", type: "toys", quantity: 50 }
{ "_id" : 10, "item" : "f4", type: "food", quantity: 75 }
- Compass
The documents appear in MongoDB Compass as the following:
Query with No Index
- Mongo Shell
- Compass
The following query retrieves documents where the quantity field has a value between 100 and 200, inclusive:
db.inventory.find( { quantity: { $gte: 100, $lte: 200 } } )
The query returns the following documents:
{ "_id" : 2, "item" : "f2", "type" : "food", "quantity" : 100 }
{ "_id" : 3, "item" : "p1", "type" : "paper", "quantity" : 200 }
{ "_id" : 4, "item" : "p2", "type" : "paper", "quantity" : 150 }
To view the query plan selected, chain the cursor.explain("executionStats") cursor method to the end of the find command:
db.inventory.find(
   { quantity: { $gte: 100, $lte: 200 } }
).explain("executionStats")
explain() returns the following results:
{
   "queryPlanner" : {
         "plannerVersion" : 1,
         ...
         "winningPlan" : {
            "stage" : "COLLSCAN",
            ...
         }
   },
   "executionStats" : {
      "executionSuccess" : true,
      "nReturned" : 3,
      "executionTimeMillis" : 0,
      "totalKeysExamined" : 0,
      "totalDocsExamined" : 10,
      "executionStages" : {
         "stage" : "COLLSCAN",
         ...
      },
      ...
   },
   ...
}
queryPlanner.winningPlan.stagedisplaysCOLLSCANto indicate a collection scan.Collection scans indicate that the
mongodhad to scan the entire collection document by document to identify the results. This is a generally expensive operation and can result in slow queries.executionStats.nReturneddisplays3to indicate that the query matches and returns three documents.executionStats.totalKeysExamineddisplays0to indicate that this is query is not using an index.executionStats.totalDocsExamineddisplays10to indicate that MongoDB had to scan ten documents (i.e. all documents in the collection) to find the three matching documents.
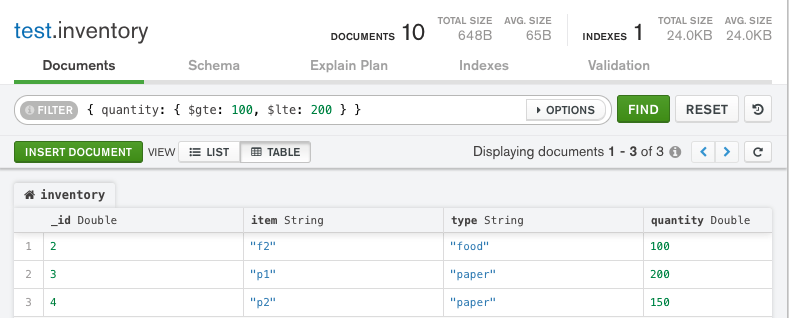
The following query retrieves documents where the quantity field has a value between 100 and 200, inclusive:
Copy the following filter into the Compass query bar and click Find:
{ quantity: { $gte: 100, $lte: 200 } }
The query returns the following documents:
To view the query plan selected:
- Click the Explain Plan tab for the
test.inventorycollection. - Click Explain.
MongoDB Compass displays the query plan as follows:
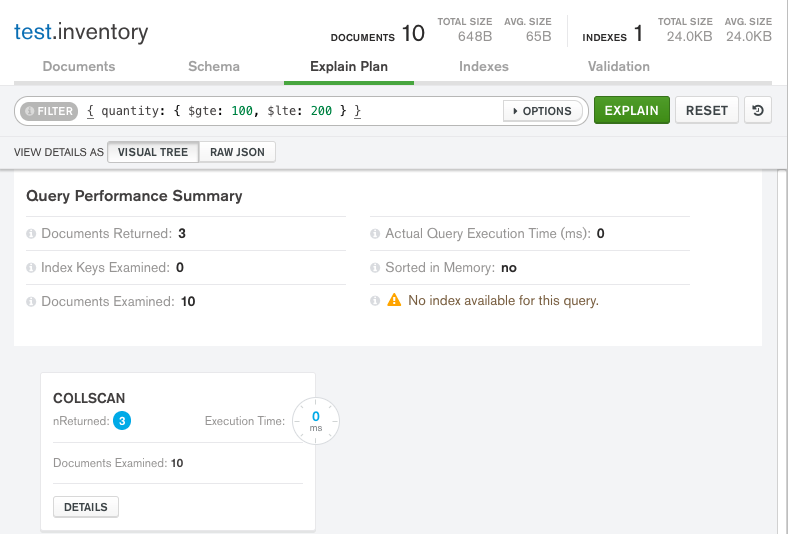
Note
Because we are working with such a small dataset for the purposes of this tutorial, the Actual Query Execution Time displays 0 seconds, even though we are not using an index.
In a larger dataset, the difference in query execution time between an indexed query versus a non-indexed query would be much more substantial.
Visual Tree
The Query Performance Summary shows the execution stats of the query:
- Documents Returned displays
3to indicate that the query matches and returns three documents. - Index Keys Examined displays
0to indicate that this query is not using an index. - Documents Examined displays
10to indicate that MongoDB had to scan ten documents (i.e. all documents in the collection) to find the three matching documents.
- Documents Returned displays
Below the Query Performance Summary, MongoDB Compass displays the
COLLSCANquery stage to indicate that a collection scan was used for this query.Collection scans indicate that the
mongodhad to scan the entire collection document by document to identify the results. This is a generally expensive operation and can result in slow queries.
Raw JSON
The explain details can also be viewed in raw JSON format by clicking Raw JSON below the query bar:
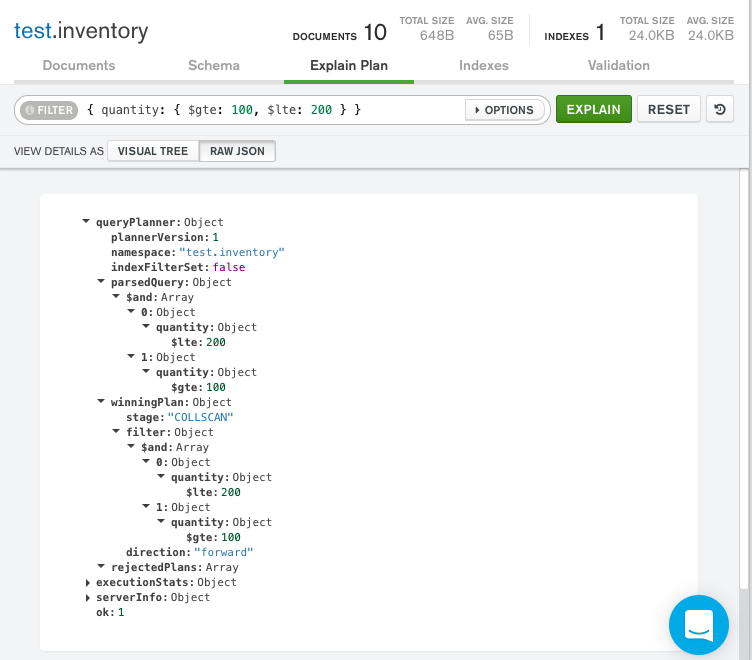
The difference between the number of matching documents and the number of examined documents may suggest that, to improve efficiency, the query might benefit from the use of an index.